- Literature
- Specifications
- Options
- Options Ctn’d
- Software
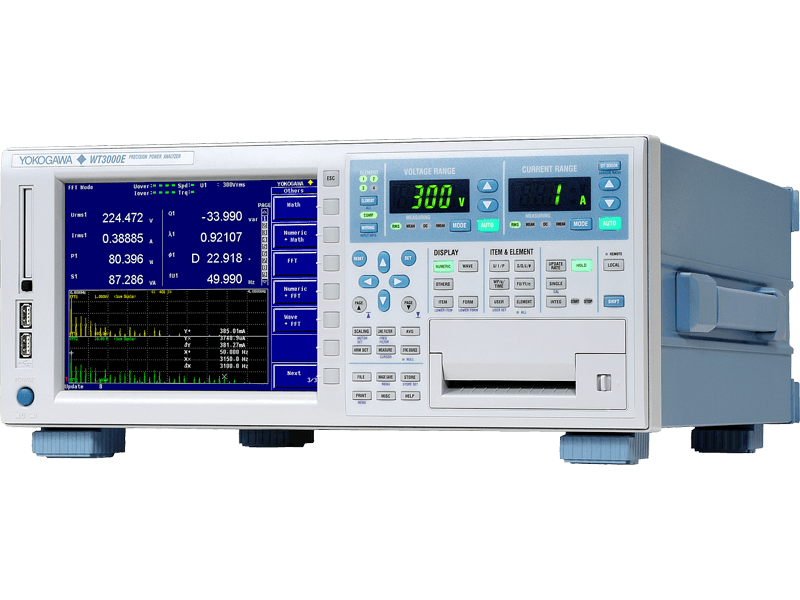
Model: Yokogawa WT3000E Power Analyzer |
|
WT3001E |
WT3002E |
WT3003E |
WT3004E |
Number of elements |
1 input elements |
2 input elements |
3 input elements |
4 input elements |
|
Available with 2A or 30A input elements |
|
|
Basic power accuracy: |
±(0.01% of reading + 0.03% of range) |
DC power accuracy |
0.05% of reading +0.1% of range |
Power frequency range: |
DC, 0.1 Hz to 1 MHz |
V / A frequency range: |
1 MHz |
Sampling Speed: |
approximately 200 kS/s |
Accuracy range – V / A: |
1% to 130% |
Plug-in inputs |
Crest Factor: Maximum 300 |
Input type |
Floating input |
Resistive voltage divider |
Direct input: Shunt input External
input: Resistive voltage divider |
|
Voltage |
(for crest factor 3) |
15 V, 30 V, 60 V, 100 V, 150 V, 300 V, 600 V, 1000 V |
(for crest factor 6) |
7.5 V, 15 V, 30 V, 50 V, 75 V, 150 V, 300 V, 500 V |
Direct Input: |
Current |
2 A input element |
|
(for crest factor 3) |
5mA, 10mA, 20mA, 50mA, 100mA, 200mA, 500mA, 1A, 2A |
(for crest factor 6) |
2.5mA, 5mA, 10mA, 25mA, 50mA, 100mA, 250mA, 500mA |
30 A input element |
|
(for crest factor 3) |
500 mA, 1 A, 2 A, 5 A, 10 A, 20 A, and 30 A |
(for crest factor 6) |
250 mA, 500 mA,1 A, 2.5 A, 5 A, 10 A, and 15 A |
External Input: |
Current Sensor |
(for crest factor 3) |
50 mV, 100 mV, 200 mV, 500 mV, 1 V, 2 V, 5 V, and 10 V |
(for crest factor 6) |
25 mV, 50 mV, 100 mV, 250 mV, 500 mV, 1 V, 2.5 V, and 5 V |
A/D converter |
Simultaneous voltage and current conversion and 16-bit resolution.
Conversion speed (sampling rate): Approximately 5 μs. |
Data Update |
|
Rate: |
50 m, 100 m, 200 m, 500 m, 1, 2, 5, 10, 20 [sec] |
Measurement Parameters |
Main: |
Voltage, current, active power, reactive power, apparent power, power factor, phase angle,
frequency, peak voltage, peak current,crest factor, integration (Wh, Ah, varh, Vah) |
|
MAX hold
Voltage RMS/MEAN simultaneous measurement
Average active power (user defined function)
Active power integration (WP) (Wh)
Apparent power integration (WS) (VAh)
Reactive power integration (WQ) (varh)
min / max. display |
Motor evaluation |
Torque, A / B / Z phase signal inputs (/MTR),4 inputs, & motor evaluation (opt |
Delta Calculation |
Voltage (V) |
difference, 3P3W ⇒ 3V3A, DELTA ⇒ STAR, STAR ⇒ DELTA |
Current (A) |
difference, 3P3W ⇒ 3V3A, DELTA ⇒ STAR, STAR ⇒ DELTA |
Power (W) |
DELTA ⇒ STAR |
FFT |
Number of points |
20,000 points or 200,000 points |
Window functions |
Rectangular, Hanning, or Flattop |
Measured parameters |
Voltage, current, active power, and reactive power of each input element.
Active power and reactive power of an Σ wiring unit.
Torque and speed signals (analog input) of motor input
Type PS (power spectrum) |
Harmonic Measurement in Normal Measurement |
Format |
PLL synchronization method |
Frequency range |
Range in which the fundamental frequency of the PLL source is 10 Hz to 2600 Hz |
Measured parameters |
Voltage, current, active power, and reactive power of each input element.
Active power and reactive power of an Σ wiring unit.
Torque and speed signals (analog input) of motor input
Type PS (power spectrum |
Window functions |
Rectangular |
FFT data length |
9000 with 32 bits processing word length |
Cycle-by-cycle measurement |
Synch source |
Select an external source of U1, I1, U2, I2, U3, I3, U4, or I4
parameters are measured continuously for each cycle of the one sync source signal |
No. of meas. |
10-3000 |
Synch source frequency range |
1 Hz to 1000 Hz (for U and I)
0.1 Hz to 1000Hz (for external sync source) |
Accuracy |
U, I, P: Add [(0.3+2*f) % of rdg + ((0.05+0.05*f) % of range]
Add [(0.3+2*f)% of reading to accuracy |
Voltage Fluctuation/Flicker Measurement |
Type: |
Normal Flicker Measurement Mode
Measurement of dmax Caused by Manual Switching Mode
Items Common to Measurement Modes |
Number of measurements |
dc |
Relative steady-state voltage change |
dmax |
Maximum relative voltage change |
d(t) |
The time during which the relative voltage change during a voltage fluctuation period exceeds the threshold level |
Pst |
Short-term flicker value
|
Plt |
Long-term flicker value |
Synch source frequency range |
1 Hz to 1000 Hz (for U and I)
0.1 Hz to 1000Hz |
Accuracy |
U, I, P: Add [(0.3+2*f) % of rdg + ((0.05+0.05*f) % of range] Add [(0.3+2*f)% of reading to accuracy |
Display---- |
Display: |
8.4-inch color TFT LCD monitor |
Waveform Display |
Numerical: |
Select 4, 8, 16, all, single list, or dual list, display res: 600000 |
Bar: |
Displays the size of each harmonic in a bar graph |
Vector: |
Vector display of the phase difference in the fundamental waves of
voltage and current. (without Single Input Element model) |
Simultaneous display: |
Two windows can be selected (from numerical display, waveform display, bar graph display, or trend display) and displayed in the
upper and lower parts of the screen |
Trend display: |
Number of measurement channels Up to 16 parameters
Displays trends (transitions) in numerical data of the measurement functions in a sequential line graph. |
Built-in Printer (/B5 Option) |
Print type: |
Thermal line/dot matrix - 8dot/mm, 112 mm [Effective print width: 104 mm] |
Environment |
Power supply: |
100 to 120VAC/220 to 240VAC (automatic switching) — 50/60Hz |
Power consumption: |
Max 150 VA (when using printer) |
Operating Temperature: |
5 to 40°C, 20 to 85% RH |
Dimensions: |
Approximately 452 (W) x 197 (H) x 497 (D) mm (including 253710 printer cover; does not include knobs and projections) |
Weight: |
Approx. 15 kg (main unit with four power modules installed) |
The Advanced Calculation Function (/G6 option) provides for wide bandwidth harmonic measurement, IEC compliant harmonic measurement (requires harmonic measurement software), FFT calculation, waveform calculation functions, and saving of waveform sampling data.
Advanced Calculation Function (/G6 option)
Wide Bandwidth Harmonic Measurement Mode
Harmonic measurement for a frequency range of 0.1 Hz – 2.6 kHz
Enables harmonic measurement over wide bandwidths. Supports measure-ment of harmonic signals beyond those of the harmonic measurement func-tion in normal measurement mode. This option allows for harmonic analysis on waveforms with a fundamental frequency range of 0.1 Hz–2.6 kHz (*1). You can measure up to the 50th order harmonic at 1 kHz fundamental.(*2).
*1 0.1–10 Hz using an external sampling clock.
*2 Harmonic measurement of up to the 20th order possible in the 1 kHz to 2.6 kHz range.
Harmonic Measurement Function
Harmonic and normal power parameters measurement at same time
This function enables simultaneous measurement of normal and harmonic data, which was impossible with previous Yokogawa models. Since with the WT3000E you can simultaneously confirm total voltage and current as well as the distortion factor and fundamental wave without switching modes, this allows for more accurate and efficient measurement of the power supply quality, the fundamental wave of motor drive voltage, and other factors.
IEC Harmonic Measurement Mode
Can perform tests conforming to international standards.
The IEC harmonic measurement mode meets the window width requirement of the latest IEC harmonic standard (10 cycles of 50 Hz and 12 cycles of 60 Hz). Also, this mode allows users to use the 761922 harmonic measurement software to perform tests conforming to IEC 61000-3-2 and IEC61000-3-12.
* These modes cannot be used at the same time.
FFT Calculation Mode
More detailed frequency analysis than with the harmonic measurement mode.
Two FFT calculations can be performed simultaneously on waveform data of measured voltage and current. You can select a resolution for FFT of 1 Hz or 10 Hz. FFT analysis of up to 100 kHz can be performed.
Waveform Calculation Mode
Monitoring of instantaneous power waveforms.
Up to two waveform calculations and other Waveform Calculation functions can be used at once. If you create a formula that multiplies voltage and current waveforms, you can confirm an instantaneous power waveform on screen. Waveform Calculation data can be saved in CSV or WVF format.
Waveform Sampling Data Saving Function
Saving of detailed waveform data for confirmation.
All captured voltage and current waveform data (200 kS/s), calculated wave-forms, and FFT calculated waveforms can be saved. You can choose to save in CSV or WVF format, and to save to PC card or USB memory (/C5 option).
Motor Evaluation Option (/MTR)
- Calculation of motor and total efficiency
In addition to the functions of the standard version, the new models offer powerful motor/inverter evaluation functions
Voltage, current, and power measurement with torque and speed input
- Measures torque meter and speed sensor output (analog or pulse output), and allows calculation of torque, revolution speed, mechanical power, synchronous speed, slip, motor efficiency, and total efficiency in a single unit.
Added Frequency Measurement (/FQ)
Checking the frequencies of all inputs
In addition to the standard two channels of frequency measurement, a six-channel frequency measurement option is also available. This option provides frequency measurement of voltage and current on all eight channels (with input elements 1 through 4 installed). This is necessary when you want to measure voltage and current frequency from the instrument’s I/O as well as voltage and current frequencies of multiple items under test at the same time.
D/A Output (/DA)
Outputting measurement values as analog signals to other devices
- 20 channels
Measured valuescan be output as ±5V 5V FS DC voltages from the D/A output connector on the rear panel. Measured parameters can be output on up to twenty channels simultaneously. Even with four input elements installed, you can send up to five types of data per element to D/A output.
- D/A zoom
Normally the D/A output function outputs DC voltage scaled to a range of -5V to 5V* with respect to the measurement range. For this reason, it may not be possible to observe fluctuations in a nearly constant signal if the D/A output is set to go to ±5V at the measurement range rated value. One case in which this could happen is when a 100V measurement voltage fluctuates in the range of ±3V.
The WT3000E has a D/A zoom function to solve such problems. This function allows the any input signal range to be scaled to between -5V and 5V* in the D/A output as Upper and Lower ranges. This makes it possible to enlarge input signal fluctuations for observation using a recorder or logger.
* The range is 0V to 5V for some functions, such as frequency measurement
Built-in printer(/B5)
- Output graphics at the touch of a button
The optional built-in printer is installed on the front side of the WT3000E, so it is easy to use even if the WT3000E is mounted on a rack. The printer can be used to print data and waveform memos. Wt3printer
- Auto Print Function
The Auto Print function allows you to set a time interval at which measured values are automatically printed on the built-in printer. You can also set a start and stop time in order to record data over a desired time period. You can also specify to print only the desired measured items.
Flicker measurement (/FL)
Video output for viewing on a larger screen
The option conforms to 100BASE-TX and 10BASE-T and provides for data exchange via communications. The option supports file transfers via FTP server, as well as FTP client (network drives), LPR client (network printers), and e-mail (SMTP client) functions.
* The WT3000E does not have a built-in hard disk. The FTP server function is available when a PC card or USB memory is inserted or connected to the PC.
VGA output (/V1)
Video output for viewing on a larger screen
The VGA port can be used to connect an external monitor in order to view numerical value data and waveforms on a larger screen. This capability is useful if you want to simultaneously check large amounts of data on a separate screen, or view data in a separate location.
WTVIEWER – harmonic Analysis software for WT3000E Series
The measurement procedures and settings for harmonic/flicker standards testing have been precisely defined. Engineers must also stay current with the specialized knowledge and up-to-date
information required to periodically review the contents of the standards and perform the standards conformance tests. The model 761922 Harmonic/Flicker Measurement Software enables
engineers without specialized knowledge to perform a range of operations using the WT3000E Precision Power Analyzer including judging standards compliance and outputting test reports.
- Harmonics
EN61000-3-2 / IEC61000-3-2
Limits for harmonic current emissions of the latest Edition
(Equipment i rated current of 16 A per phase or less)
EN61000-3-12 / IEC61000-3-12
Limits for harmonic current emissions
(Equipment rated current is of 75 A per phase or less, and more than 16 A per phase)
- Voltage fluctuation/flicker
EN61000-3-3 / IEC61000-3-3
Limitation of voltage fluctuations and flicker
(Equipment rated current of 16 A per phase or less, and not subject to conditional)
EN61000-3-11 / IEC61000-3-11
Limitation of voltage fluctuations and flicker supply systems
(Equipment rated current of 75 A or less, and subject to conditional)
- IEC61000-4-7 1991(window widths of 16 cycles), IEC61000-4-7 2002(Harmonic and interharmonic measurement supporting window widths of 50 Hz/60 Hz, 10/12 cycles)
- Viewing Trends
You can capture various types of data measured into your PC at 200ms fixed intervals. Thus, you can view trends graphically. This feature lets you monitor power
supply voltage fluctuations, changes in current consumption and other time-based variations.
- Harmonic Current Measurement Value List
Displays harmonic measurement data as a single list.
- Harmonic Current Bar Graph
Evaluates whether harmonic data is within the standard limit value, and displays the result as a bar graph. The display of evaluation results is color-coded, in colors such as red and blue.
- Measurement Value Judgement Graph
Measures the harmonic current over the set observation time, and evaluates it in conformance with the standard. Evaluation results are displayed as PASS or FAIL
- Waveform Observation
Lets you display voltage or current signal waveforms, and measure frequencies and peak values. Moving the cursor lets you display values for the displayed waveform.
- Automatic Report Generation
You can print harmonic measurement results as value lists and graphs, and save image data. Titles and comments can be entered in reports, letting you enter
information such as measurement dates/times, device names or control numbers.
Power Consumption Measuring Software
-
Power Consumption Measuring Software
A comprehensive solution – standby power consumption measurement software.
- Meets the Requirements of IEC62301 Ed2.0(2011) Household electrical appliances – Measurement of standby power and EN 50564:2011 Electrical and electronic household and office equipment – Measurement of low power consumption.
- New standby power consumption measurement software that conforms with the testing methods specified in the IEC62301 Ed2.0(2011) standard and EN 50564:2011 has been introduced for the Yokogawa range of digital power analyzers.
- Allows the user to perform measurements according to IEC62301 Ed2.0(2011): Household electrical appliances – measurement of standby power and EN 50564:2011 – Electrical and electronic household and office equipment – Measurement of low power consumption.
- The software sets up the appropriate test conditions by 3 type measuring mode(Ed1.0/Ed2.0(auto)/Ed2.0(manual), measures the power values, and creates a test report based on the requirements of the IEC62301 Ed2.0(2011) and EN 50564:2011 standards. Key parameters measured and incorporated in the test report include total harmonic distortion(THD measurement), crest factor, RMS voltage, frequency, measurement period and power.
|